Description
BugMaps-Granger is a tool that supports detection of causal relations between source code metrics and bugs. Basically, this tool provides mechanisms to automate the process of retrieving software repositories data, computing source code metrics, creating source code metrics and defect time series, and identifying causal relations between source code properties and defects and that provides visualizations for decision support.
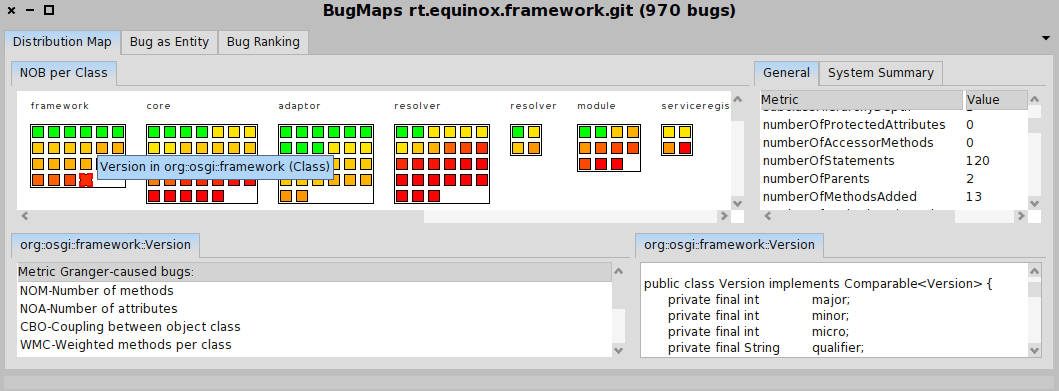
The visualizations provided by BugMaps-Granger are based on Distribution Map, a generic technique to reason about the result of software analysis and to help to understand how a given phenomenon is distributed across a software system. Using Distribution Map three metrics can be displayed through height, width and color of the objects in the map. In our maps, small rectangles represent classes or bugs and containers represent packages.
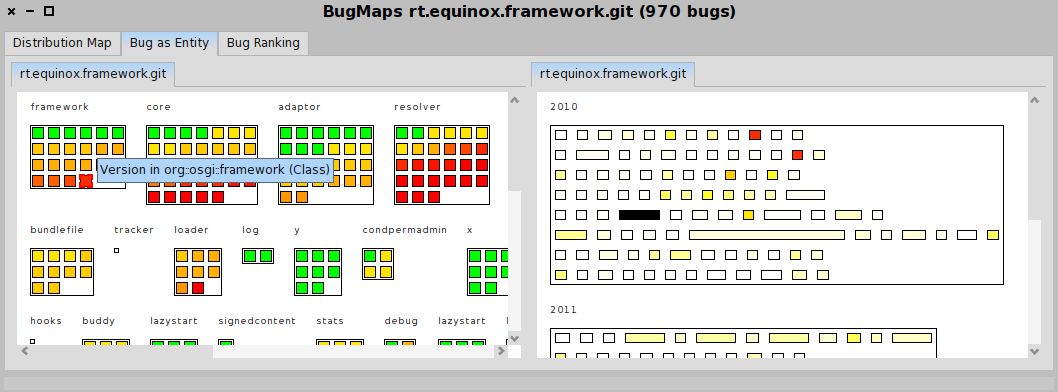
Two browsers are then used for analysis, one to deal with the classes, the number of bugs, and the Granger results of the system under analysis (called Granger browser) and other to deal with the complexity of the bugs (called Bug as Entity browser). Such browsers are implemented in the Moose Platform.
Granger browser:
Bug as Entity browser: